11. Which of the following is correct statement ?
A. uromatrix lizard stores water in the intestine
B. Camel stores water in its stomach
C. Anabus develops accesary respiratory organs to respire in water.
D. Kangaroo rat undegeoes hibernation.
Answer : Option C
12. Parasitic animal which is part of bio-geo community and included as zoo planktons and mesofauna of tenestrial ecosystem is ....
13. From the given option which is the appropriate for ecto parasite animal Ascaris, Tapeworm, plas modium, mites
A. phytoplanktons
B. mesofauna
C. macrofauna
D. phytoplanktons and mesofauna.
Answer : Option C
14. Which living organism is seen in the hot water spring having temperature more than 100 C?
15. Find out population density. Since last 4 years number of lions in a squre forest is 500 (length of forest =10 km)
A. 1.25 lions/year . k \(m^{2}\)-- year
B. 12.5 lions/ k \(m^{2}\)
C. 1.025 lions/ \(cm^{2}\) month
D. 12.5 lions/k \(m^{2}\) - month
Answer : Option A
16. Average human population in a certain time area is 5000 in which 1111 children are produced during an years, find out the birth rate ?
17. In birthrate and deathrate is equal, then what will be the Vital Index ?
Which option is correct for the given statement .
Statement X : Density dependent factors are intrinsic Reason R : They are generated in
population only
A. Both statement are true
B. Both statement are false
C. X is true, y is false
D. X is false, Y is true
Answer : Option A
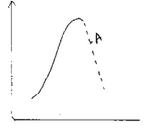
In a population of frog ‘J’ type of population growth curve is seen than which
information from the given graph can be true for “ point A”
(i) Vital Index < 100
(ii) Birth rate < death rate
(iii) Birht rate > death rate
The given graph shows seasonal changes in the population of Birds of Gujarat in the
year 2002. In the given graph what is true for point X ?
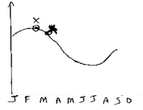
A. Vital Index <100
B. Vital Index >100
C. Vital Index =100
D. None of these
Answer : Option D